By Alina Schnake-Mahl | January 11, 2022
The COVID-19 pandemic has not impacted all populations equitably. Hispanic, Black, and Indigenous populations have experienced disproportionate rates of COVID-19 cases and mortality. Research suggests these disparities are primarily driven by excess exposure, rather differences in susceptibility (e.g., underlying conditions), or access to care. Higher rates of occupation in high risk and essential occupations and living in multi-generational and crowded housing likely contribute to these exposure disparities. In the early months of vaccine distribution, vaccination coverage for Hispanics/Latinos lagged far behind non-Hispanic Whites (NHW),potentially exacerbating the existing disparities in COVID-19 related morbidity and mortality. The disparities in vaccination likely reflected structural challenges accessing vaccinations, especially for undocumented populations, including lack of paid sick leave to take time off work for vaccination and side effect recovery, challenges with easily accessible vaccination sites, vaccination sites asking for identification, and limited vaccination information in Spanish.
In this post we examine how COVID-19 vaccination disparities in Hispanic/Latino compared to non-Hispanic Whites have changed since the vaccination rollout began. We include monthly data from 14 cities with data on vaccination by race-ethnicity, available for at least 4 months (to show changes over time), and group cities by census regions (East, Midwest, South, West). We did not track vaccination data by race longitudinally in the first six months of the pandemic, so we only include data beginning in July, 2021. We include both relative (rate ratios) and absolute (rate differences) disparity measures (see here) for a more comprehensive view of these two measures
Findings
Fig 1. Absolute Disparities in non-Hispanic White Compared to Hispanic Vaccination Rates, July 2021-January 2022
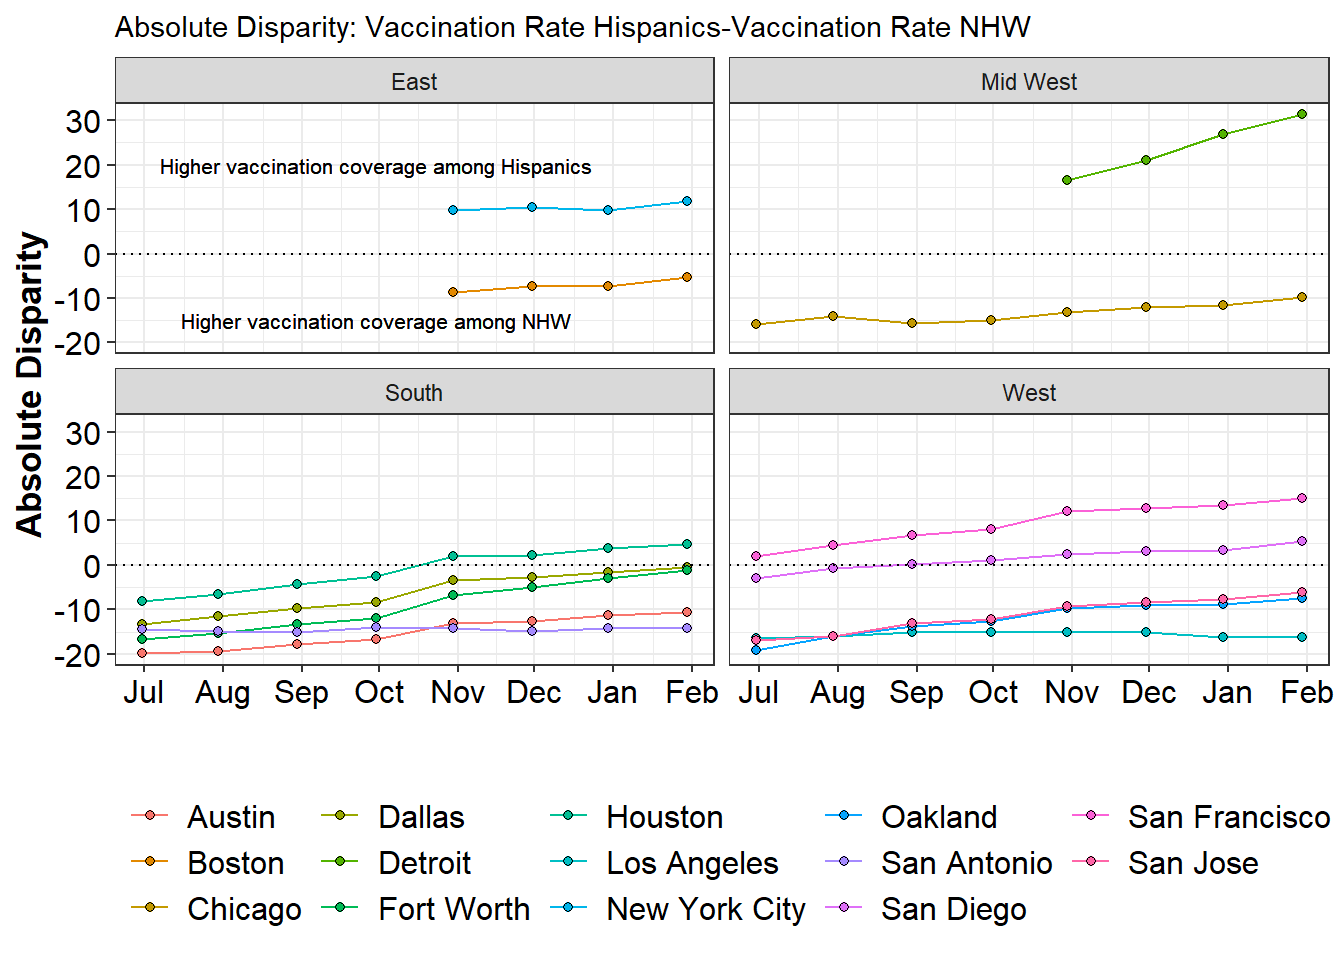
Fig 2. Relative Disparities in non-Hispanic White Compared to Hispanic Vaccination Rates, July 2021-January 2022
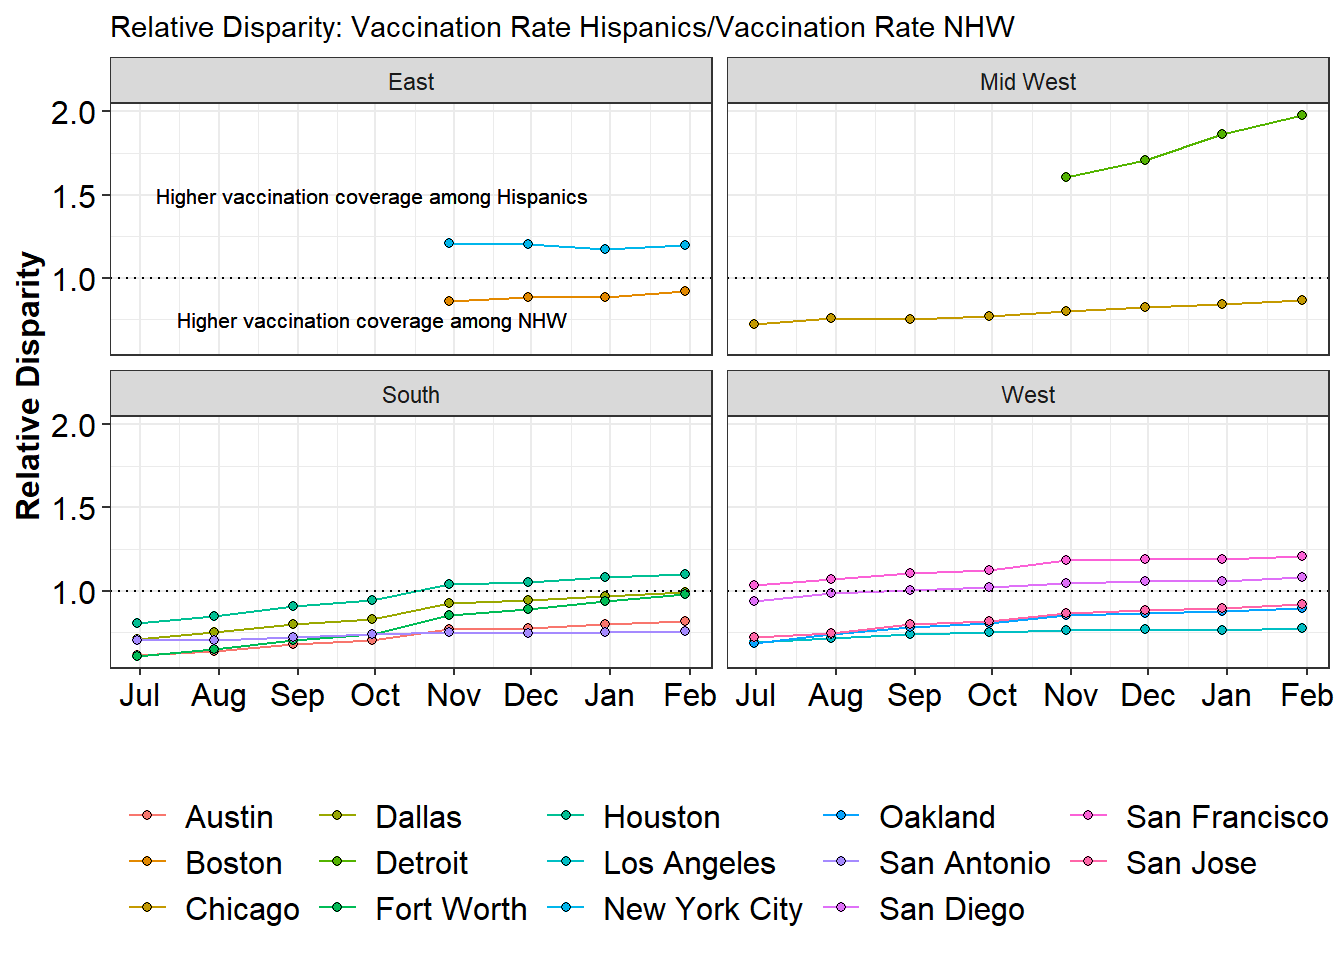
Figure 1 shows absolute disparities over time by city and region, and Figure 2 shows relative disparities. In July, rates of vaccination among Hispanics were lower than among non-Hispanic Whites in all cities with available data, except for San Francisco. Across both relative and absolute measures, disparities generally declined over time in most cities, with the exception of Los Angeles and San Antonio where they barely changed (shrunk by 1.8% in Los Angeles and by 1.4% in San Antonio). In Los Angeles, vaccination rates in both Hispanics and Non-Hispanic Whites increased at similar rates, so that while vaccination rates increased by nearly 20 percentage points in both groups from July to the end of January, disparities did not substantially shift over time. The same pattern emerged in San Antonio, though vaccination rates among Hispanics and non-Hispanic Whites only increased by 11 percentage points there from July to the end of January.
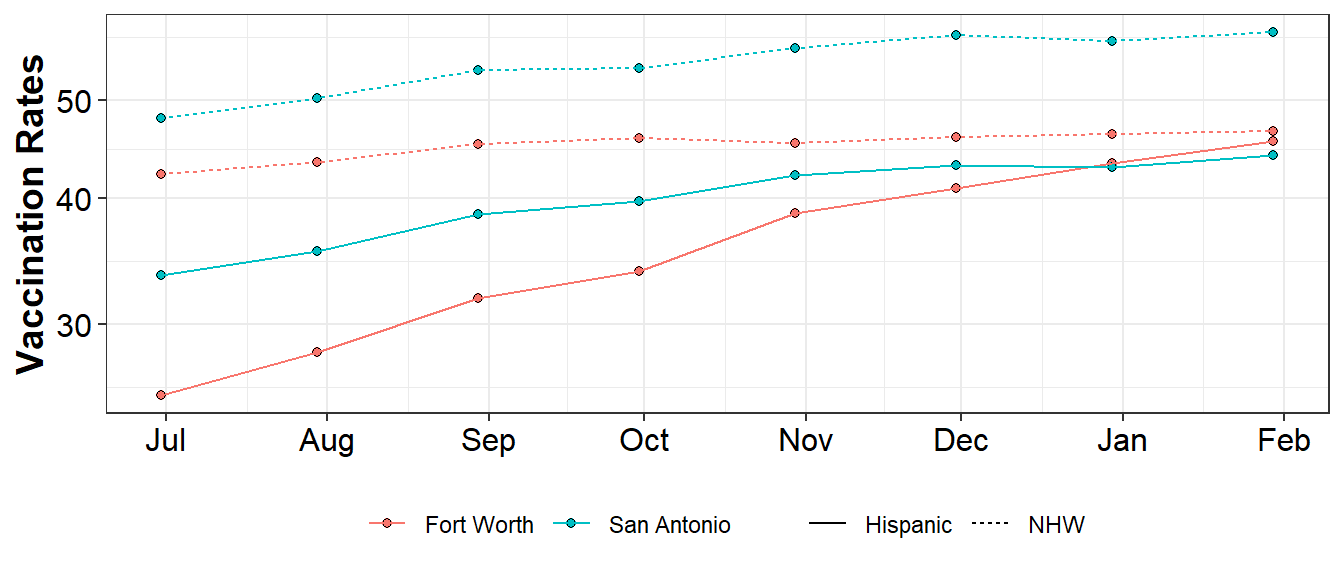
By January 2022, disparities were inverted (higher coverage among Hispanics) in five of the 14 cities (San Diego, San Francisco, Houston, New York City, and Detroit), and were almost non-existent in Dallas and Fort Worth, as shown in Figure 3. The largest change in absolute disparities occurred in Fort Worth, Texas, going from a 16.7 percentage point disparity to only a 1.1 percentage point disparity. Notably, the decrease in vaccination disparities in Fort Worth was due to a 78% increase in vaccination rates among Hispanics, and only a 10.4% increase in vaccination rates among non-Hispanic Whites
Fig 3. Vaccination rates in San Antonio and Fort Worth by race-ethnicity
We do not explore reasons for changes in disparities here but refer readers to our forthcoming article on disparities among Hispanics in COVID-19 outcomes (forthcoming in the American Journal of Public Health) and also to our forthcoming article on disparities in vaccination coverage by neighborhood social vulnerability (forthcoming in the American Journal of Epidemiology). We will link these two articles here once they are published.