By EDWIN M. MCCULLEY | December 23, 2021
What are COVID-19 waves?
As of December 2021, the ongoing COVID-19 pandemic is responsible for nearly 52 million confirmed cases, and over 800,000 deaths in the United States (US). While COVID-19 is a novel virus, coronavirus transmission follows multiwave dynamics that are similar to other infectious diseases.1 Multiwave dynamics refer to ‘waves’ of COVID-19 infection, characterized by surges and declines in the number of new COVID-19 cases (i.e., COVID-19 incidence). To date, public health researchers have identified several factors that impact the surges and declines in new cases that are associated with waves of pandemic COVID-19. These factors include, but are not limited to human behavior, prevention policies, vaccine efficacy over time, and virus mutations. These factors, coupled with jurisdictional COVID-19 mitigation measures, help lower viral transmission, especially during spikes in new COVID-19 cases.
Early Waves of COVID-19
Figure 1 describes the distribution of COVID-19 cases in US cities belonging to the Big Cities Health Coalition (BCHC) by census region.
Fig 1. Daily Counts and Rates by Census Region
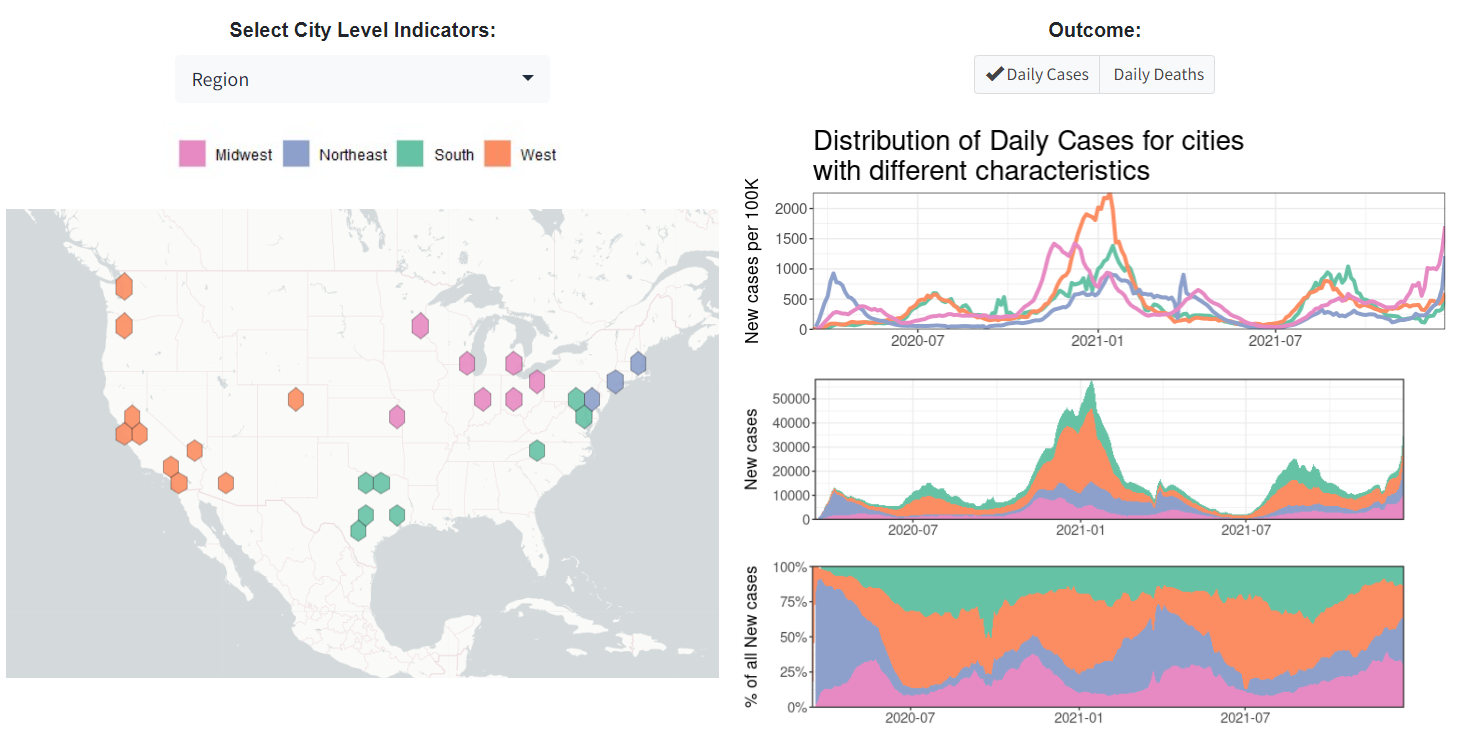
While defining waves is tricky, especially as transmission is a local phenomenon (and therefore some waves may affect some areas of the US but not others), there have been some clear patterns in the last 21 months. The first wave consisted of an increase in new cases during March and April 2020, followed by a gradual decrease through spring 2020. This wave was especially focused in the Northeastern US and some parts of the Midwest. The second wave was characterized by rising cases during the summer of 2020, especially in the Southern and Western US. The third wave, which had the largest spike in terms of magnitude and duration occurred during the late fall and winter of 2020-2021, following Thanksgiving and the winter holidays, and affected the entire US.
In December of 2020, the Food and Drug Administration (FDA) authorized several vaccines, which helped gradually decrease the number of new cases through June of 2021, although an increase in cases in the Northeast and Midwest was evident during the spring of 2021. At that point, the vaccine roll-out continued to be accompanied in some jurisdictions by the uptake of several other important public health interventions, like social distancing, and mask mandates, which likely contributed to the decline in COVID-19 incidence. By late June of 2021, the number of new COVID-19 cases in the US had reached an all-time low, and many jurisdictions that still had some public health policies in place lifted them. The US experienced another surge of new cases in July 2021, starting in the South and West. This fourth wave coincided with the emergence of the delta variant; a viral mutation of the coronavirus (i.e., SARS-CoV-2) that causes COVID-19. At this time, the delta variant began to circulate in US populations, so much so that by August 2021, the Centers for Disease Control and Prevention (CDC) declared the delta variant the predominant strain of coronavirus in the US. This variant was highly transmissible, driving an increase in the number of new COVID-19 cases over the course of the summer through early September 2021, making the delta variant the most contagious form of coronavirus thus far. While there was no longer a clear spike in cases, new cases continued to increase until mid-September, followed by a slow decrease in COVID-19 incidence in early November 2021.
Current Waves of COVID-19
In November 2021, and partially thanks to the unequal vaccine rollout globally, yet another viral mutation was detected by scientists in South Africa, the omicron variant. The omicron variant emerged quickly, considering the emergence of delta in summer 2021, with the first US case reported to the CDC in late November 2021. While the omicron variant remains poorly understood, especially in terms of its severity, this variant appears to be highly transmissible and was quick to replace delta as the predominant strain of coronavirus. By late December, 75% of newly detected cases in the US have been estimated to be due to the omicron variant. The emergence of omicron was patterned by the onset of the fifth wave in the US (or even sixth wave, if we consider the smaller one in Spring 2021 to be its own wave). By December 2021, US cases began to increase exponentially; this increase can be observed for BCHC cities using the COVID-19 Health Inequities in Cities Dashboard.
Nationally, as we prepare for yet another winter marked by a spike in new cases, there is a need to continue describing how the pandemic has affected US cities, especially among the most vulnerable populations.
Figure 2 details the timeline of COVID-19 waves in US cities belonging to the Big Cities Health Coalition (BCHC). As evident in this data, the number of new cases in US cities continues to rise, which may be driven by the emergence of the highly contagious omicron variant.
Fig 2. Trends in all BCHC Cities
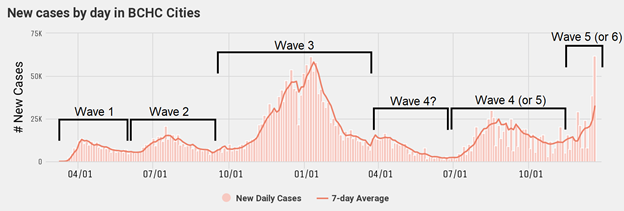
Since early November 2021 the number of new COVID-19 cases in BCHC cities has nearly tripled, from 10,899 new cases on 11/02/2021 to 32,354 new cases on 12/20/2021; marking the arrival of the fifth (potentially sixth) wave of pandemic COVID-19 in cities across the US. While a majority of cities display an increase in the number of new COVID-19 cases, the magnitude varies by city. This is especially evident when examining Figure 3.
Fig 3. Percent Change in New Cases per 100K over a 4-week period in US Cities from 11/29/2021 to 12/20/2021
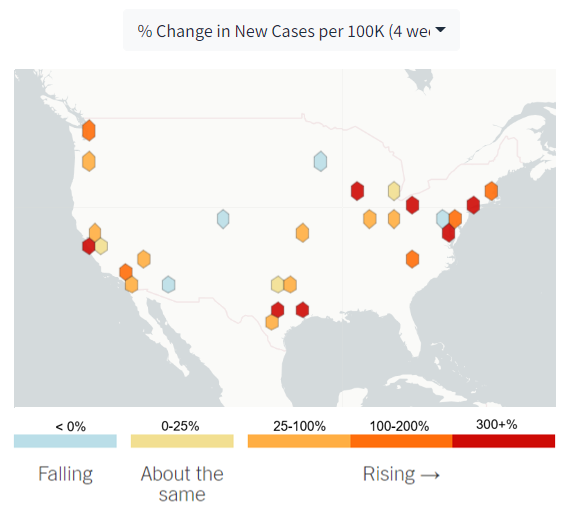
Figure 3 shows the percent change in new COVID-19 cases over a 4-week period (from 11/29/2021 to 12/20/2021) in BCHC cities. Here, we see increases in new cases ranging from 7.1% (San Jose) to 429.8% (Houston). Across cities, the average percent change in new cases over this period was roughly 112% on average. Over the past 4-weeks, nearly 40% of all cities experienced a doubling in the number of new COVID-19 cases. Aside from rising cases in cities, a few cities have experienced a decrease in COVID-19 incidence in the past 4-weeks, notably Denver (-42.2%), Phoenix (-22.1%), and Minneapolis (-12.1%). To summarize, over the past 4-weeks the rate of new COVID-19 cases increased in 24 of the 28 cities included in our analysis.
COVID-19 Inequities in US Cities
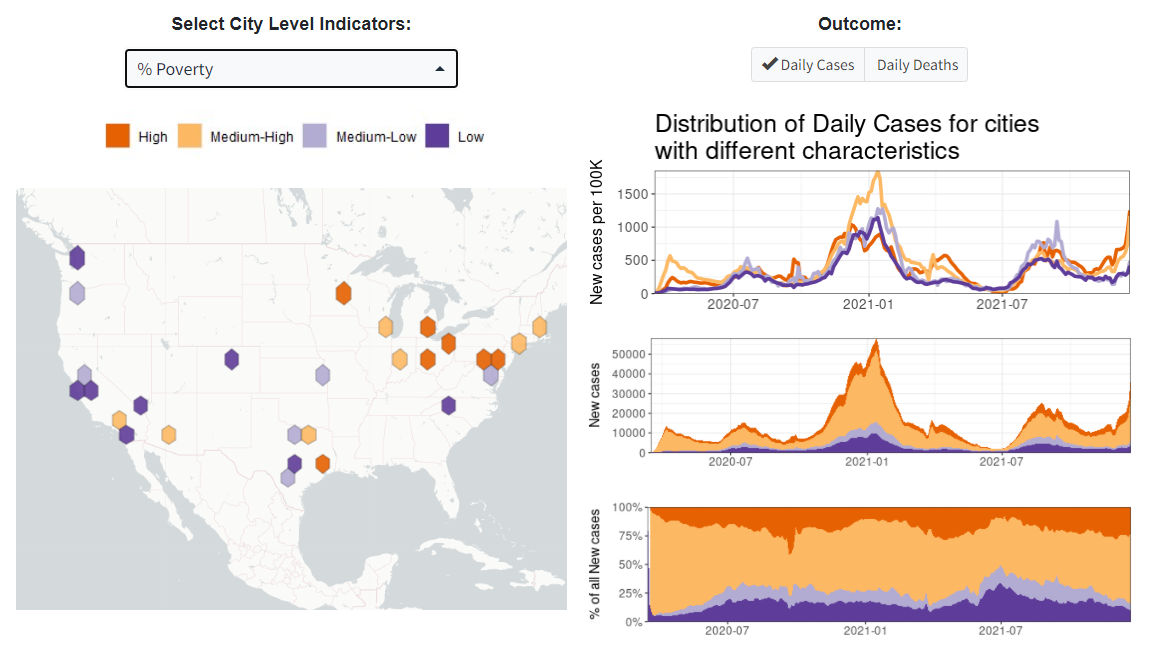
While providing a snapshot of rising cases in US cities is important, these trends may be obscuring health inequities in COVID-19 outcomes. The COVID-19 pandemic has highlighted longstanding racial and socioeconomic inequities in the US. We have previously observed and documented disparities in COVID-19 outcomes by race and ethnicity over time. There are several additional socioeconomic factors that contribute to these inequities such as occupation and poverty. In figure 4, we see the rates of new COVID-19 cases by levels of poverty in each city. Here we can see lower incidence rates among cities with lower poverty rates, an inequity which appears to have widened during the omicron wave of COVID-19 in the US. Previous waves have displayed a similar relationship between poverty status and new cases; however, the magnitude of this relationship seems to be more pronounced during the ongoing omicron wave.
Fig 4. Daily Counts and Rates by Percent Poverty in US Cities
What’s Next?
As 2021 draws to a close, the number of new cases in the US continues to rise, and the CDC warns of a potential rapid increase of omicron variant infections. These increases in new cases are likely due to several factors including the increased transmissibility of the omicron variant, and the variant’s ability to evade immunity gained from previous infection or vaccination, and, most importantly, the absence of any public health measure except for vaccination and some attempts at increasing rapid testing.2 Recently the CDC has conducted several simulation studies aimed toward understanding future scenarios, and found that regardless of immune escape, there is an increased likelihood of yet another surge in new cases in the coming weeks.3 In accompaniment, CDC officials warn that new cases could soon surpass previous peaks, which can result in increasing the burden of disease in US populations and potentially straining hospital systems across the nation. The CDC maintains its position that vaccines are the best public health measure to protect individuals from COVID-19, and recommends hand-washing, mask-wearing, and testing as these interventions offer protection against all variants of coronavirus. However, as we have previously shown4, other public health interventions are also key to controlling this pandemic.
References
Cacciapaglia G, Cot C, Sannino F. Multiwave pandemic dynamics explained: How to tame the next wave of infectious diseases. Scientific reports. 2021;11(1):1-8.
Scudellari M. How the pandemic might play out in 2021 and beyond. Nature. 2020:22-25.
Centers for Disease Control and Prevention. Potential Rapid Increase of Omicron Variant Infections in the United States. In: Centers for Disease Control and Prevention; December 20th, 2021.
Schnake-Mahl AS, O’Leary G, Mullachery PH, et al. The impact of keeping indoor dining closed on COVID-19 rates among large US cities: a quasi-experimental design. Epidemiology. 2021.