By Edwin M. McCulley | March 12, 2021
Cities play an important role in connecting people by proximity while offering several benefits to its inhabitants. However, city living is accompanied by potential health risks and challenges unique to modern cities. City living, in close proximity, brings together businesses and individuals that drive innovation, productivity, and socioeconomic growth in cities. However, under some conditions, city living is also accompanied by increased crowding. Overcrowded conditions are associated with decreased quality of life, unsafe living conditions, substandard housing, and poor sanitation; all of which can potentially exacerbate the transmission of infectious diseases in vulnerable populations.
The idea that city size is a driver of increased COVID-19 incidence is a common topic of discussion and debate. Initially, the narrative of big cities being the hotspot of COVID-19 cases was driven by the idea that density increased the likelihood of transmission. However, while the assumption of higher density of social contacts leading to higher rates of infection may be correct, this ignores the settings in which transmission occurs. Specifically, enclosed and poorly ventilated crowded spaces seem to be the key drivers of COVID-19 transmission.
In our COVID-19 Inequities in BCHC Cities dashboard, we include a section where the user can explore rates of COVID-19 by city-level features, including their size, density, and levels of overcrowding. In this blog post, we present two types of visualization that explore how rates of COVID-19 incidence have varied by city size on one side, and density and crowding on the other.
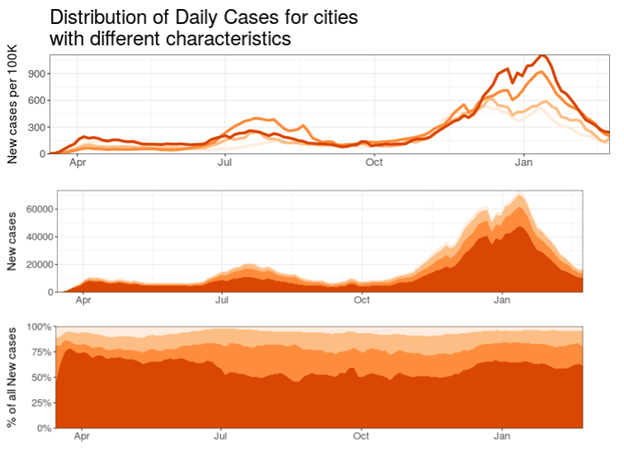
This figure presents results from the “City levels and trends” section of the dashboard. By April 2020, the COVID-19 pandemic had infected over 1 million people globally. The US was the country with the highest number of confirmed cases of COVID-19 infection, nearly 82,000 cases. During the first wave, the number of new cases per 100k population in cities was highest in very large (>=4M) and smaller (<1M) cities. In June, incidence decreased in small and very large cities, and increased in medium (<2M) and large (<4M) cities. By summer, we observed a second wave, where large and medium cities experienced higher rates of new cases than small and very large cities. During the third wave, in the fall of 2020, we observed increased rates of new cases in large cities, followed by medium, small, and very large cities. This trend continued into 2021, when the number of new cases decreased in small and medium cities. In February, these rates decreased across the board, with small and medium cities experiencing relatively fewer new cases than their large- and very large city counterparts.
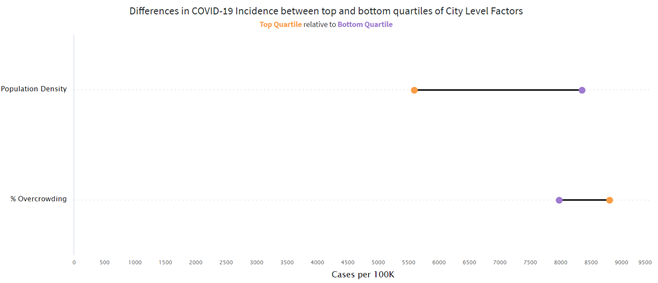
This figure presents results from the City Level Inequities section of the dashboard. For this figure, we have grouped the cities in the dashboard into the top and bottom quartiles (top 25% and bottom 25%) of cities based on several features. In this figure, we show two key features: population density (people per square mile) and % overcrowding (% of the population living in overcrowded conditions, defined as more than 1 occupant per room in a household). As we can see, cities with the highest density have a lower cumulative incidence, with 5592 cases per 100,000, while cities with the lowest density in our sample have a higher cumulative incidence at 8346 cases per 100,000. On the other hand, overcrowding shows the opposite patterns. Cities with the highest levels of overcrowding have the highest incidence, at 8806 cases per 100,000, while cities with the lowest levels of overcrowding have lower rates, at around 7975 cases per 100,000.
There are positive and negative health aspects of city living. In terms of city size, the relationship between city size and health appears to vary based on several other factors, such as geographic context, city definition, and specific health outcomes. Although there are several studies that examine the relationship between city size and communicable diseases, there are very few that focus on COVID-19 infection. Several communicable diseases such as chlamydia, gonorrhea, syphilis, and HIV are more common in large cities, and tend to increase with increasing city size (1). On the other hand, traffic fatalities tend to be relatively more common in smaller cities (2). City living offers many health benefits and is accompanied health risks; understanding the underlying factors that drive health in cities is critical to address the unique challenges presented to public health in cities and urban settlements around the globe.
REFERENCES
1. Patterson-Lomba O, Goldstein E, Gómez-Liévano A, Castillo-Chavez C, Towers S. Per capita incidence of sexually transmitted infections increases systematically with urban population size: a cross-sectional study. Sexually transmitted infections. 2015;91(8):610-614.
2. Chang YS, Lee WJ, Lee JH. Are there higher pedestrian fatalities in larger cities?: A scaling analysis of 115 to 161 largest cities in the United States. Traffic injury prevention. 2016;17(7):720-728.